
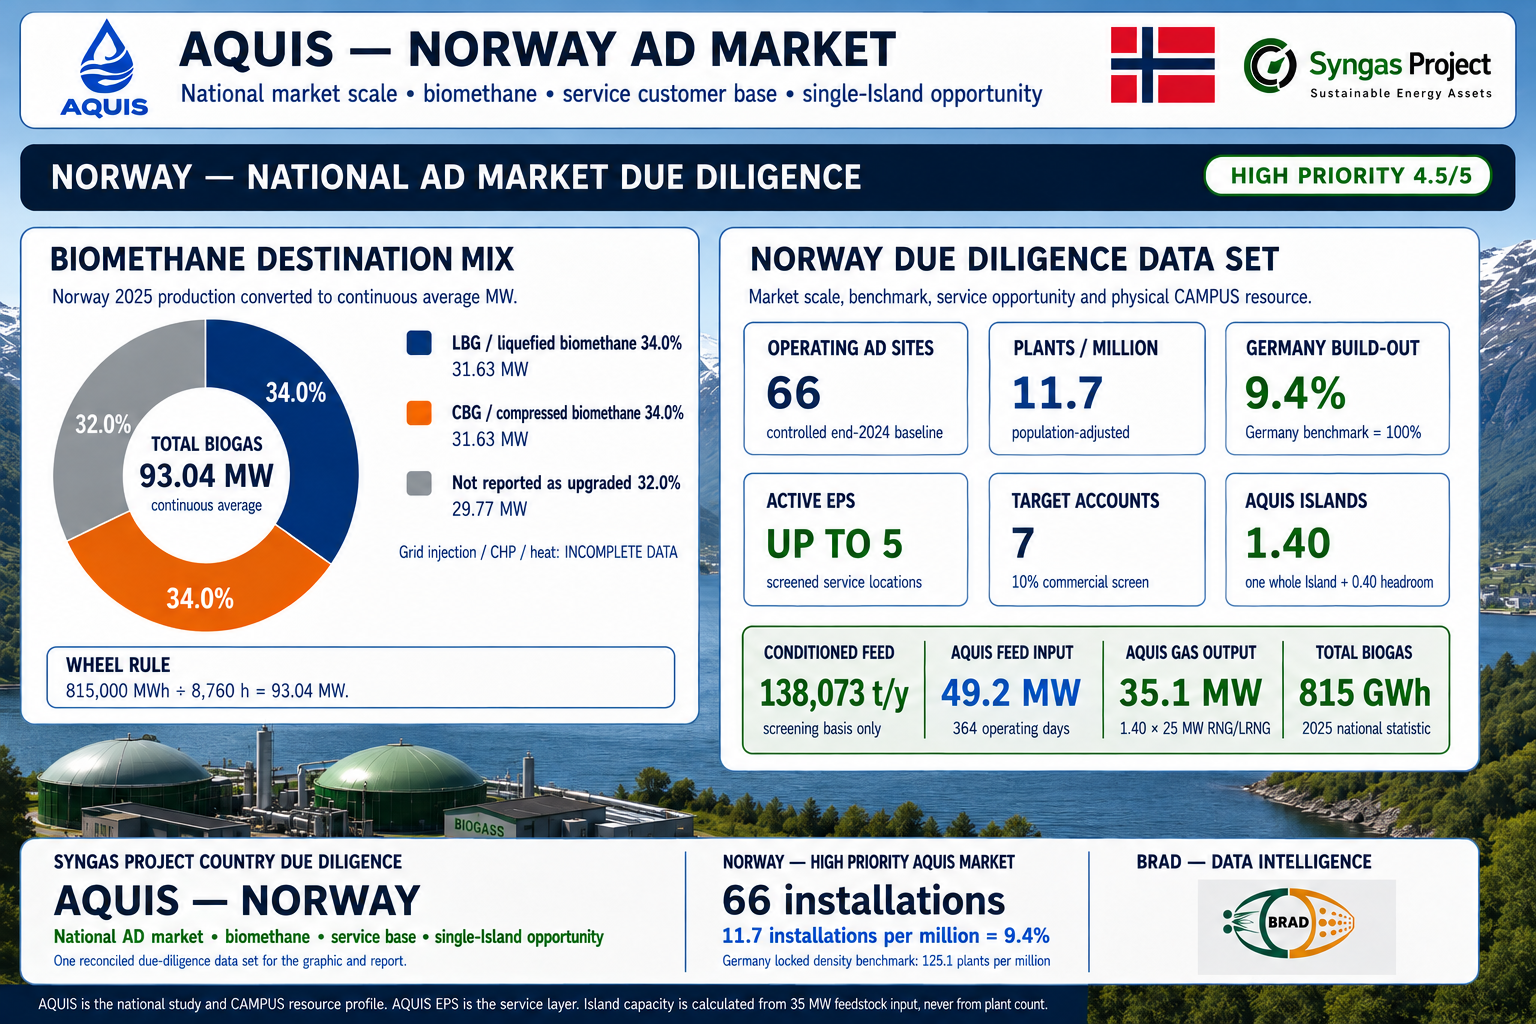
Norway is rated 4.8/5—Very High Priority. Its 2024 wheel is distinctive and fully reconciled: 94.52 MW total, divided between 34.25 MW unupgraded gas/CHP, 27.63 MW CBG and 32.65 MW LBG.
AQUIS — NORWAY AD MARKET DUE DILIGENCE
AQUIS Services, AQUIS Active EPS, CUMULUS and CAMPUS market-entry assessment
Assessment date: 31 July 2026
Priority: 4.8/5 — Very High Priority
Status: Final evidence-controlled country text
Master format: Poland 23-section country standard
CONTROLLING-DATA NOTICE
This report establishes the first evidence-controlled Norway baseline for the AQUIS AD Services European Market Register.
It replaces any earlier Norway calculation that converted plant numbers, target customers or market share directly into AQUIS Islands.
The operating-plant count defines the potential service-location market. It does not determine physical AQUIS Island capacity.
Three separate calculations are used:
- Norway’s operating market is defined by 66 operating biogas installations.
- Norway’s national methane-equivalent output wheel is calculated from 828 GWh of reported 2024 biogas production and its documented production routes.
- AQUIS Island capacity is calculated only from recoverable, conditioned physical feed with sufficient solids, energy content, logistics and contractual availability.
The 2024 Norwegian market produced 828 GWh of biogas, equivalent to 94.52 MW continuous.
The documented production routes were:
- 300 GWh of unupgraded biogas retained for CHP, heat or other raw-biogas uses
- 242 GWh upgraded to compressed biogas, or CBG
- 286 GWh upgraded and liquefied as LBG/BioLNG
This produces the following approved Norway wheel:
- Engine/CHP, heat and unupgraded gas: 34.25 MW — 36.23%
- CBG/compressed transport gas: 27.63 MW — 29.23%
- LBG/liquefied transport and marine-capable gas: 32.65 MW — 34.54%
- Verified national grid-injection allocation: Incomplete data
- Verified direct-industrial allocation: Incomplete data
The wheel reports the production route. It must not claim that all Norwegian LBG was consumed by shipping. Norwegian national evidence confirms LBG production, but a complete end-customer allocation between heavy road transport, marine use and industry has not been published.
The most recent Norwegian food-system digestate study provides a separate physical screening floor. It covers livestock manure, food waste, fish sludge and fish ensilage, but excludes the full sewage-sludge and industrial-resource market.
That study identifies:
- 500,000 tonnes/year of current wet feedstock
- 98,000 tonnes/year of current feedstock dry matter
- 1,913,000 tonnes/year of current wet digestate after process-water addition
- 49,000 tonnes/year of digestate dry matter
Conditioning 49,000 tonnes of dry matter to a product containing 80% solids and no more than 20% moisture produces approximately 61,250 tonnes/year of conditioned feed.
At 11.2 MJ/kg, this documented subset represents:
- 190,556 MWh/year of conditioned-feed energy
- 21.81 MW operating feed input over 364 days
- 0.62 AQUIS Island-equivalent
- No full Island without upward rounding
- 15.58 MW of alternative RNG/LRNG output
- Approximately 49,900 litres/day of alternative 2G ethanol
This is an evidence floor, not the complete Norwegian AQUIS opportunity. Sewage sludge is Norway’s largest biogas feedstock category but is not included in the physical food-system calculation. BRAD must therefore build a complete national mass balance before the full current Island opportunity can be stated.
Norway’s development pipeline is substantially larger. The same 2026 study identifies 36 proposed new or expanded facilities with approximately 2,565 GWh of additional production potential. Its broader food-system scenario estimates approximately 26.5 million tonnes/year of future wet digestate and approximately 679,000 tonnes/year of digestate dry matter.
On the same controlled conditioning basis, this could represent approximately:
- 849,000 tonnes/year of conditioned feed at 80% solids
- 302.5 MW of conditioned-feed operating input
- 8.64 AQUIS Island-equivalents
- Eight full Islands without upward rounding
- Two complete three-Island clusters plus two additional Islands
- 216.1 MW of alternative RNG/LRNG output
- Approximately 691,000 litres/day of alternative 2G ethanol
These are development-screening values. They combine projects in construction, planning and development and must not be described as operating capacity.
NORWAY — RECONCILED NATIONAL OPPORTUNITY
| Measure | Norway position | Basis |
| Population | 5,594,340 | Statistics Norway, 1 January 2025 |
| Operating biogas installations | 66 | Norwegian Biogas Statistics 2024 |
| Increase during 2024 | 7 installations | Norwegian Biogas Statistics 2024 |
| Plants per million inhabitants | 11.8 | 66 ÷ 5.594 million |
| Germany benchmark | 125.1 plants/million | 10,455 plants; 83.60 million people |
| Deployment density relative to Germany | 9.4% | 11.8 ÷ 125.1 |
| Absolute market scale relative to Germany | 0.63% | 66 ÷ 10,455 |
| Total 2024 biogas production | 828 GWh/year | Norwegian Biogas Statistics 2024 |
| Total continuous methane-equivalent output | 94.52 MW | 828 GWh ÷ 8,760 hours |
| Unupgraded gas/CHP and heat | 300 GWh; 34.25 MW | Balance after CBG and LBG production |
| CBG production | 242 GWh; 27.63 MW | Upgraded production less LBG |
| LBG production | 286 GWh; 32.65 MW | Norwegian Environment Agency |
| Total upgraded CBG and LBG | 528 GWh; 60.27 MW | 64% of national production |
| National grid-injection allocation | Incomplete data | No reconciled national allocation identified |
| Verified direct-industrial allocation | Incomplete data | Not separated in national statistics |
| Biogas filling stations | 38 operating | Norwegian Biogas Statistics 2024 |
| Additional filling stations announced | 31 | Development pipeline; not operating baseline |
| Initial target accounts | 7 | 10% of 66, rounded |
| Direct AQUIS Services screen | 2 | Initial strategic allocation |
| AQUIS Active EPS screen | Up to 5 | Initial strategic allocation |
| AQUIS EPS potential locations | 66 | Subject to technical qualification |
| Current food-system digestate | 1.913 million t/year wet | SINTEF-linked 2026 study |
| Current food-system digestate dry matter | 49,000 t/year | Same study |
| Current conditioned-feed evidence floor | Approximately 61,250 t/year | 49,000 t dry matter conditioned to 80% solids |
| Current AQUIS feedstock input | 21.81 MW | 11.2 MJ/kg over 364 days |
| Current evidenced Island-equivalent | 0.62 | Physical food-system subset only |
| Full Islands currently supported by this subset | 0 | No upward rounding |
| Current alternative RNG/LRNG equivalent | 15.58 MW | 0.62 Island × 25 MW |
| Current alternative 2G ethanol equivalent | Approximately 49,900 L/day | 0.62 Island × 80,000 L/day |
| Future food-system conditioned-feed screen | Approximately 849,000 t/year | Development scenario; not operating |
| Future Island-equivalents | 8.64 | Development scenario |
| Future full Islands without upward rounding | 8 | Conditional development opportunity |
| Future alternative RNG/LRNG equivalent | 216.1 MW | 8.64 Islands × 25 MW |
| Future alternative 2G ethanol equivalent | Approximately 691,000 L/day | Alternative use of the same capacity |
| CUMULUS position | Immediate plant-level services; first aggregated full train conditional | Gas-flow and composition verification required |
RNG/LRNG and 2G ethanol are alternative uses of the same Hydrogen Producer Gas capacity. They must never be added together as simultaneous outputs.
- EXECUTIVE SUMMARY
Norway is a small but strategically advanced AD and biomethane market. The controlling baseline is 66 operating biogas installations producing 828 GWh/year, equivalent to 94.52 MW of continuous methane-equivalent output. A 10% commercial screen produces seven target accounts, provisionally allocated between two direct AQUIS Services relationships and up to five AQUIS Active EPS clients.
Norway’s significance is not defined by plant count alone. It is one of Europe’s clearest examples of a biogas market moving beyond conventional CHP. In 2024, 528 GWh—64% of total national production—was upgraded to CBG or LBG. LBG accounted for 286 GWh and became the largest individual upgraded route. This gives Norway a strong position in heavy transport, marine-capable renewable gas, distributed fuel logistics and biological CO₂ recovery.
With 11.8 installations per million inhabitants, Norway has approximately 9.4% of Germany’s installed AD deployment density. Its 66 installations represent only 0.63% of Germany’s absolute operating base. This does not indicate weak resource potential. It reflects Norway’s dispersed population, long distances, limited agricultural concentration, strong wastewater role and preference for larger regional waste-treatment and fuel-production assets.
The current physical Island evidence remains incomplete. A 2026 study covering livestock manure, food waste, fish sludge and fish ensilage identifies approximately 1.913 million tonnes/year of wet digestate and 49,000 tonnes/year of digestate dry matter. On the controlled AQUIS conditioning basis, this supports 0.62 Island-equivalent, but no full Island without upward rounding. Sewage sludge—the largest Norwegian feedstock category—is excluded from this calculation, so the result is a conservative evidence floor rather than a national ceiling.
Norway’s future opportunity is considerably larger. Thirty-six proposed new or expanded facilities represent approximately 2,565 GWh of additional production potential. The related food-system scenario could support approximately 8.64 Island-equivalents, equivalent to eight full Islands, two complete three-Island clusters and two additional Islands. This would represent 216.1 MW of alternative RNG/LRNG output or approximately 691,000 litres/day of alternative 2G ethanol. None of this pipeline is counted as operating capacity.
The AQUIS market proposition is strengthened by Norway’s environmental direction. Sewage sludge, food waste, manure, fish sludge and fish ensilage concentrate nutrients, water and any persistent contaminants entering the process. Norway is actively developing controls for PFAS, microplastics, organic pollutants, nutrient losses and sludge quality. AQUIS can provide the missing controlled pathway between digestion, water recovery, pollutant capture, nutrient recovery and permanent treatment of contaminated media.
The recommended entry route is to establish Norway as a principal Nordic market alongside Sweden; qualify seven anchor accounts; prioritise the Oslofjord–Østfold–Västra Götaland corridor, Trøndelag, Western Norway and major wastewater operators; build the complete BRAD feed-and-digestate register; and develop the first full Island only when at least 35 MW of contracted conditioned-feed input is physically demonstrated.
- METHOD AND EVIDENCE CONTROLS
This report keeps six measures separate:
- Operating installations define potential service locations.
- Target accounts define the initial commercial programme.
- Reported national biogas energy defines the hero wheel.
- CBG and LBG production define production routes, not necessarily final end users.
- Conditioned physical feed determines AQUIS Island capacity.
- Development projects remain separate from operating plants and production.
Plant count is never divided by an assumed number of plants per Island.
Target accounts are never converted directly into Island capacity.
Announced filling stations, proposed plants, awarded support and development pipelines are never counted as operating infrastructure.
The current Island calculation covers only the published Norwegian food-system subset. It does not extrapolate this subset to sewage sludge or the complete national market.
Where evidence is unavailable, the report states Incomplete data.
- NATIONAL MARKET DEFINITION
The 66-installation baseline covers Norway’s operating biogas market in 2024.
The market includes:
- Municipal and industrial wastewater digestion
- Sewage-sludge digestion
- Household and commercial food waste
- Livestock manure
- Fish sludge
- Fish ensilage and aquaculture by-products
- Agricultural and farm-scale systems
- Industrial organic residues
- CHP and heat production
- CBG upgrading
- LBG/BioLNG production
- Transport-fuel supply
- Emerging marine, industrial and biological-CO₂ applications
Norwegian statistics distinguish operating production from development plans. This distinction must remain in the AQUIS register.
- NATIONAL OPERATING BASE
Norway had 66 operating biogas installations in 2024, seven more than in 2023.
National production increased from a revised 724 GWh in 2023 to 828 GWh in 2024, an increase of approximately 14%.
The sector supports approximately 1,400 full-time-equivalent jobs and contributes approximately NOK 1.66 billion in annual value creation, excluding construction.
The market is small in absolute plant numbers but increasingly industrial in output, logistics and technology.
BRAD must reconcile:
- Facility
- Site
- Operator
- Owner
- Feedstock
- Gas-production volume
- Upgrading configuration
- CBG output
- LBG output
- Internal CHP and heat use
- CO₂ recovery
- Digestate treatment
- Current operating status
- Development status
- POSITION COMPARED WITH GERMANY
| Indicator | Norway | Germany | Norway relative to Germany |
| Operating installations | 66 | 10,455 | 0.63% |
| Population | 5.594m | 83.60m | 6.7% |
| Plants per million | 11.8 | 125.1 | 9.4% |
| Historic dominant route | Mixed wastewater, CHP and fuel | CHP plus biomethane | Different structure |
| Upgraded share | 64% | Established but structurally different | Norway is highly upgrade-focused |
| LBG position | 286 GWh | Not the dominant national route | Norwegian differentiator |
| National gas-grid route | Limited/incomplete allocation | Extensive | Norway favours distributed fuel logistics |
Norway is less densely deployed than Germany, but its production-route maturity is advanced. The market already directs most output to CBG and LBG rather than retaining all gas for engine duty.
Future Norwegian development is unlikely to reproduce Germany’s farm-CHP fleet. It is more likely to favour larger regional plants, manure aggregation, municipal and food-waste treatment, aquaculture residues, wastewater, LBG production and distributed fuel logistics.
- METHANE AND ENERGY DESTINATION
Norway produced 828 GWh of biogas in 2024.
The approved conversion is:
828 GWh ÷ 8,760 hours = 94.52 MW continuous methane-equivalent output
Documented upgrading to CBG and LBG totalled 528 GWh.
Norwegian Environment Agency evidence records 286 GWh of LBG production in 2024. The balance of upgraded output is therefore 242 GWh of CBG.
The remaining 300 GWh was not upgraded and is allocated to engine/CHP, heat or other raw-biogas use.
| Production route | Annual energy | Continuous MW | Wheel share |
| Engine/CHP, heat and unupgraded gas | 300 GWh | 34.25 MW | 36.23% |
| CBG/compressed transport gas | 242 GWh | 27.63 MW | 29.23% |
| LBG/liquefied transport and marine-capable gas | 286 GWh | 32.65 MW | 34.54% |
| Total | 828 GWh | 94.52 MW | 100% |
| Separately verified grid injection | Incomplete data | Incomplete data | Not allocated |
| Separately verified direct-industrial use | Incomplete data | Incomplete data | Not allocated |
| Confirmed marine consumption | Incomplete data | Incomplete data | Not equal to total LBG production |
Hero colours:
- Green: 36.23% — Engine/CHP, heat and unupgraded gas
- White: 29.23% — CBG/compressed transport gas
- Yellow: 34.54% — LBG/liquefied transport and marine-capable gas
- Blue: no separately verified national grid-injection allocation
- Red: no separately reconciled direct-industrial allocation
The wheel must state that yellow represents the LBG production route. It must not imply that 286 GWh was consumed entirely by ships.
- WASTEWATER AND SEWAGE-SLUDGE MARKET
Sewage sludge is Norway’s largest biogas feedstock category.
Major wastewater plants combine:
- Sludge thickening
- Anaerobic digestion
- Biogas upgrading or internal energy use
- Dewatering
- Nutrient management
- Final sludge treatment
- Water discharge and reuse
- Gas cleaning
- Biological CO₂ separation
Veas, serving the Oslo region, produced approximately 10.6 million Nm³ of biogas in 2024. Except during production disturbances, its gas is upgraded and sold externally as BioLNG.
Norwegian wastewater operators are strategically important AQUIS clients because they combine sludge, water, gas, nutrients and pollutant-control obligations on one site.
Priority AQUIS duties include:
- PFAS testing and capture
- Microplastic and nanoplastic aggregation
- Water recovery
- Sludge dewatering
- Nutrient separation
- Siloxane control
- Returnable filtration
- Permanent treatment of spent media
- Biological CO₂ polishing
- Traceability of captured pollutants
- AGRICULTURAL AND MANURE MARKET
Livestock manure currently makes a relatively small contribution to Norwegian biogas output, but it dominates the development pipeline.
The 2026 food-system study attributes only 26 GWh of current production to livestock manure but identifies approximately 2,101 GWh of future manure-based potential in the project and resource scenario.
Norway’s agricultural support system encourages manure delivery to biogas plants. In the 2024 application round, 85 applicants sought support for manure delivered during 2023.
Nineteen facilities receiving manure were identified across nine of Norway’s eleven counties.
Most material is liquid manure:
- Approximately two-thirds cattle manure
- Approximately one-third pig manure
- Typical dry-solids content between 3% and 10%
- Some dewatered pig manure around 32% solids
- Poultry manure between approximately 45% and 75% solids
This variability makes water separation, dry-matter measurement, logistics and final-product routing essential.
- FOOD WASTE, AQUACULTURE AND MARINE RESOURCES
Norway’s resource base is broader than conventional agricultural AD.
The current food-system biogas contribution is estimated as:
| Feedstock | Current 2024 biogas contribution |
| Livestock manure | 26 GWh |
| Food waste | 254 GWh |
| Fish sludge | 17 GWh |
| Fish ensilage | 88 GWh |
| Total food-system subset | 385 GWh |
The corresponding current feedstock quantities are:
| Feedstock | Wet mass | Dry matter |
| Livestock manure | 199,000 t/year | 15,000 t/year |
| Food waste | 205,000 t/year | 61,000 t/year |
| Fish sludge | 38,000 t/year | 4,000 t/year |
| Fish ensilage | 59,000 t/year | 18,000 t/year |
| Total | Approximately 500,000 t/year | 98,000 t/year |
Aquaculture gives Norway an opportunity unavailable at comparable scale in most European markets.
Fish sludge and ensilage can support:
- Biogas production
- Nutrient recovery
- Phosphorus recovery
- Protein and material recovery
- Water treatment
- Coastal circularity
- Reduced nutrient discharge
- Regional LBG production
Collection and transport remain significant constraints, particularly for dispersed coastal and offshore resources.
- DIGESTATE RESOURCE AND AQUIS ISLAND CALCULATION
The 2026 food-system study estimates:
| Measure | Current | Future scenario |
| Wet digestate | 1.913 million t/year | 26.496 million t/year |
| Digestate dry matter | 49,000 t/year | 679,000 t/year |
| Nitrogen | 1,806 t/year | 34,971 t/year |
| Phosphorus | 384 t/year | 7,472 t/year |
The current digestate has approximately 2.6% dry matter and is commonly dewatered to approximately 15–25% solids.
Complete drying is energy-intensive. The study estimates approximately 89.82 GWh/year would be required to dewater and dry the current food-system digestate, with drying accounting for more than 99% of that energy demand.
AQUIS must therefore prioritise:
- Water removal before thermal duty
- Screw presses, centrifuges and filter presses where appropriate
- Partial rather than universal drying
- Use of recovered and waste heat
- Separation of clean nutrient products
- Selection of only the recoverable combustible fraction
- Avoidance of unnecessary transport of water
Current controlled calculation:
| Calculation stage | Value |
| Digestate dry matter | 49,000 t/year |
| Conditioned material at 80% solids | 61,250 t/year |
| Assumed conditioned-feed value | 11.2 MJ/kg |
| Annual feed energy | 190,556 MWh/year |
| Operating period | 364 days/year |
| Conditioned-feed operating input | 21.81 MW |
| Input per AQUIS Island | 35 MW |
| Annual input per Island | 305,760 MWh |
| Island-equivalents | 0.62 |
| Full Islands without upward rounding | 0 |
| Alternative RNG/LRNG equivalent | 15.58 MW |
| Alternative 2G ethanol equivalent | Approximately 49,900 L/day |
Development-scenario calculation:
| Calculation stage | Value |
| Future digestate dry matter | Approximately 679,000 t/year |
| Conditioned material at 80% solids | Approximately 849,000 t/year |
| Conditioned-feed input | Approximately 302.5 MW |
| Island-equivalents | Approximately 8.64 |
| Full Islands without upward rounding | 8 |
| Three-Island cluster equivalents | 2 complete clusters plus 2 additional Islands |
| Alternative RNG/LRNG equivalent | Approximately 216.1 MW |
| Alternative 2G ethanol equivalent | Approximately 691,000 L/day |
The development scenario is not an operating-market claim. Every Island requires a regional contracted mass balance.
- AQUIS SERVICES OPPORTUNITY
The initial commercial screen allocates two of Norway’s seven target accounts to direct AQUIS Services.
Priority direct-service clients are likely to include:
- Large wastewater and sludge facilities
- Regional food-waste plants
- LBG producers
- Aquaculture-residue aggregators
- Multi-feedstock installations
- Plants with difficult digestate logistics
- Facilities recovering biological CO₂
- Operators facing PFAS, microplastic or siloxane controls
Direct AQUIS Services should include diagnostic sampling, mass balance, contaminant mapping, water recovery, microbial conditioning and final-treatment planning.
- AQUIS ACTIVE EPS OPPORTUNITY
Up to five target accounts are provisionally allocated to AQUIS Active EPS.
The broader technical market contains 66 potential service locations, subject to qualification.
The Active EPS package can include:
- AQUIS EXTRACT
- AQUIS FLOCC
- AQUIS GUARD
- AQUIS PFAS
- AQUIS POLISH
- Returnable filter cartridges
- Sealed spent-media return
- Water and digestate conditioning
- Nutrient and mineral recovery
- Final-water polishing
- BRAD performance monitoring
The five-account allocation is a commercial entry screen, not a limit on the long-term market.
- CUMULUS OPPORTUNITY
Norway is a high-value CUMULUS market because 64% of national biogas output is already upgraded to CBG or LBG.
Priority duties include:
- Hydrogen sulfide and sulfur compounds
- Siloxanes
- Moisture
- Particulates
- Trace organic compounds
- Final methane quality
- Liquefaction protection
- CO₂ separation and polishing
- Filter-media monitoring
- Engine, CBG and LBG specification control
A complete national count of upgrading trains has not been reconciled.
CUMULUS should initially target plant-level gas-treatment and monitoring services. The first full aggregated CUMULUS train linked to AQUIS Island deployment remains conditional on at least 35 MW of verified conditioned-feed input.
- BIOMETHANE, CBG AND LBG MARKET
Norway has developed a distributed biomethane model suited to its geography.
In 2024:
- 528 GWh was upgraded to CBG or LBG
- Upgraded gas represented 64% of total production
- LBG production reached 286 GWh
- LBG production increased by approximately 23% from 2023
- CBG production represented the remaining approximately 242 GWh
- 38 biogas filling stations were operating
- 31 further stations were announced
The announced stations must not be added to the operating baseline until commissioned.
Norway’s market is particularly suitable for LBG because liquefaction allows renewable methane to be transported without a national distribution-grid connection.
- GRID AND DISTRIBUTED GAS INFRASTRUCTURE
Norway does not rely on the same national biomethane grid-injection model as Germany, France or Denmark.
The country has major natural-gas production and export infrastructure, but domestic renewable-gas distribution is shaped by:
- CBG filling stations
- LBG terminals
- Road-tanker logistics
- Industrial delivery
- Municipal transport contracts
- Regional fuel hubs
- Potential marine bunkering
- Cross-border Nordic trade
No reconciled national grid-injection allocation has been identified for the 2024 production wheel.
The blue grid segment is therefore recorded as Incomplete data rather than estimated.
- TRANSPORT, MARINE AND INDUSTRIAL OPPORTUNITY
Norway’s 38 operating biogas filling stations create an established platform for road transport.
Government transport policy supports new city buses using zero-emission technology or biogas and seeks to ensure that new heavy vehicles are zero-emission or use biogas by 2030.
LBG is suited to:
- Heavy road freight
- Long-distance logistics
- Construction machinery
- Ferries
- Coastal shipping
- Offshore and service vessels
- Industrial heat
- Distributed high-energy fuel supply
Norway produced 286 GWh of LBG in 2024. The Norwegian Environment Agency states that current production is already committed under existing supply contracts.
A complete split between road, marine and industrial consumption is unavailable. The hero must therefore show LBG as a production route, not a confirmed marine-consumption total.
- NATIONAL POLICY POSITION
Norway’s policy framework supports biogas through:
- Enova investment support for industrial-scale production
- Bionova support for farm-scale systems
- Support for delivery of livestock manure
- CO₂ taxation on fossil fuels
- Exemption from relevant road-use duties
- Public procurement
- Food-waste separation requirements
- Heavy-transport policy
- Maritime decarbonisation
- Circular-economy policy
- Nutrient recycling
- EU and EEA environmental alignment
The Norwegian government states that biogas production is circular resource management and expects more feedstock from food-waste separation, aquaculture, manure and stricter wastewater treatment.
- FUNDING AND DEVELOPMENT PIPELINE
Enova awarded NOK 550 million to new biogas production projects in 2024.
The supported projects represented approximately 1.1 TWh/year of potential additional production.
Bionova also supported:
- Four farm-scale biogas facilities
- Ten biogas feasibility projects
- One digestate upgrading and storage project
Awarded support is not operating production.
The current development register identifies 36 new or expanded facilities representing approximately 2,565 GWh of potential additional output. Of these, 26 are manure-based projects representing approximately 2,075 GWh.
High capital cost, feedstock access, digestate use, logistics and project delivery remain key barriers.
- STRATEGIC OPERATORS AND INSTALLATIONS
| Operator or installation | Current position | Strategic relevance |
| St1 Biokraft, Skogn | Major Norwegian LBG facility; approximately 125–155 GWh production position, with larger liquefaction capability | Large-scale fish-industry, industrial-water and LBG platform |
| Veas, Slemmestad | Norway’s largest wastewater-treatment facility; approximately 10.6 million Nm³ biogas in 2024, primarily upgraded to BioLNG | Sewage sludge, LBG, CO₂, PFAS, microplastics and CUMULUS opportunity |
| Den Magiske Fabrikken | Approximately 120 GWh/year capacity using food waste and manure | Integrated biogas, biofertiliser and biological-CO₂ reference |
| IVAR | Major wastewater, sludge and resource-recovery operator in Rogaland | Western Norway water, sludge, nutrients and process integration |
| Rå Biopark, Skibotn | New northern regional biogas development | Northern Norway agriculture, fish resources and long-distance logistics |
| BIR/Voss development | Regional food-waste and biogas development | Western Norway municipal and regional opportunity |
| Gasum Vormstad project | Proposed capacity up to approximately 150 GWh/year using up to 500,000 t/year of organic material | Large manure and regional-resource aggregation opportunity |
| Havila Biogass developments | Multiple proposed LBG plants using agricultural and aquaculture wastes | Marine, coastal and regional LBG growth platform |
Operating status, ownership and commissioned production must be checked before commercial engagement.
- ENVIRONMENTAL AND REGULATORY NEED
Norwegian AD systems concentrate nutrients, water, solids and any persistent contaminants entering the process.
Relevant risks include:
- PFAS
- Microplastics and nanoplastics
- Siloxanes
- Pharmaceuticals
- Organic pollutants
- Metals
- Excess nitrogen
- Excess phosphorus
- Pathogens
- Salinity in marine-derived resources
- Spent filtration media
- Nutrient hotspots
- Long-distance transport of wet digestate
Norway has worked with the Netherlands, Germany, Sweden and Denmark on a broad European restriction covering more than 10,000 PFAS substances.
Norwegian wastewater research has identified PFAS and other organic contaminants in sewage sludge. Norwegian authorities and the water industry are reassessing the risks associated with agricultural use of sludge.
This does not establish that every Norwegian sludge or digestate stream is contaminated. It establishes the need for measurement, source control, risk-based separation and a permanent route for captured contaminants.
- REGIONAL DEPLOYMENT STRATEGY
| Region | Initial rationale |
| Oslofjord, Akershus, Oslo, Østfold and Vestfold | Population, wastewater, Veas, Den Magiske Fabrikken, food waste, filling stations and cross-border logistics |
| Østfold–Västra Götaland–Dalsland corridor | Norway–Sweden road-freight, CBG/LBG distribution and shared Nordic service coverage |
| Trøndelag | Skogn, food processing, agriculture, fish-industry residues and industrial integration |
| Rogaland and Western Norway | Livestock, aquaculture, food processing, IVAR, maritime demand and industrial gas users |
| Vestland | Fish resources, coastal logistics, Voss/BIR development and marine applications |
| Innlandet | Agricultural manure, regional aggregation and proximity to Eastern Norway demand |
| Nordland, Troms and Finnmark | Aquaculture, fish waste, Rå Biopark, remote communities and long-distance fuel logistics |
| Agder and southern industrial corridor | Ports, industry, transport and potential Nordic maritime routes |
The Oslofjord–Dalsland–Västra Götaland corridor should be treated as a linked Norway–Sweden commercial region rather than two isolated national markets.
- PRINCIPAL RISKS AND FINANCING CONCLUSION
| Risk | Exposure | Required control |
| Small absolute plant base | Medium | Focus on strategic operators and portfolios |
| Dispersed geography | High | Regional hubs and route optimisation |
| Water-heavy digestate | High | Dewatering before transport or thermal duty |
| Full national mass balance unavailable | High | BRAD plant-level reconciliation |
| Sewage-sludge data excluded from Island screen | High | Separate wastewater solids register |
| Upward rounding of Islands | High | Retain 0.62 as a partial current equivalent |
| Development pipeline uncertainty | High | Separate operating, construction and planned assets |
| Manure logistics | High | Catchment contracts and transport-cost analysis |
| Aquaculture collection | High | Verify collection technology and regulatory requirements |
| Nutrient-market limits | Medium-high | Regional N and P balance |
| PFAS and microplastic liability | Medium-high | Accredited sampling and permanent treatment |
| CBG/LBG price competition | Medium | Contracted offtake and route analysis |
| Swedish and Danish subsidy interaction | Medium | Nordic competition and cross-border review |
| Gas-quality compliance | High | CUMULUS monitoring and polishing |
| Drying-energy demand | High | Partial drying and recovered-heat integration |
Norway remains a 4.8/5 Very High Priority Market.
The investment case is supported by:
- A measurable operating market
- Rapid 2024 production growth
- A 64% upgraded-gas share
- Strong LBG capability
- Established transport infrastructure
- Major wastewater assets
- Aquaculture and fish-industry resources
- A large manure-led development pipeline
- Government investment support
- Strong environmental and pollutant-control drivers
- Direct commercial connection with Sweden
Final investment approval is not yet supported for a complete current AQUIS Island because the published food-system evidence supports only 0.62 Island-equivalent and excludes the national sewage-sludge mass balance.
The future development case could support eight full Islands, but only if projects become operational and conditioned feed is contracted.
- DECISION AND NEXT ACTIONS
Syngas Project decision
Proceed with Norway as a principal AQUIS, CUMULUS and future CAMPUS-development market alongside Sweden.
Controlled operating-market position
- 66 operating biogas installations
- 828 GWh/year of 2024 biogas production
- 94.52 MW continuous methane-equivalent output
- 34.25 MW Engine/CHP, heat and unupgraded gas
- 27.63 MW CBG production
- 32.65 MW LBG production
- 64% of output upgraded to CBG or LBG
- 38 operating filling stations
- Seven initial target accounts
- Two direct AQUIS Services targets
- Up to five AQUIS Active EPS targets
Controlled current physical evidence floor
- 1.913 million tonnes/year of food-system wet digestate
- 49,000 tonnes/year of food-system digestate dry matter
- Approximately 61,250 tonnes/year of conditioned feed
- 21.81 MW of conditioned-feed operating input
- 0.62 AQUIS Island-equivalent
- No full current Island without upward rounding
- 15.58 MW of alternative RNG/LRNG output
- Approximately 49,900 litres/day of alternative 2G ethanol
Conditional future development screen
- Approximately 2,565 GWh of additional project potential
- Approximately 26.5 million tonnes/year of future wet food-system digestate
- Approximately 679,000 tonnes/year of future digestate dry matter
- Approximately 849,000 tonnes/year of conditioned feed
- Approximately 302.5 MW of feedstock input
- 8.64 AQUIS Island-equivalents
- Eight full Islands without upward rounding
- Two complete three-Island clusters plus two additional Islands
- 216.1 MW of alternative RNG/LRNG output
- Approximately 691,000 litres/day of alternative 2G ethanol
Required next actions
- Build the complete BRAD register of all 66 operating installations.
- Separate facilities, sites, operators, owners and technology providers.
- Identify every CBG and LBG upgrading installation.
- Confirm the end-use allocation of CBG and LBG between road, marine and industry.
- Qualify the first seven commercial target accounts.
- Approach two anchor operators for direct AQUIS Services assessment.
- Select up to five AQUIS Active EPS demonstration locations.
- Build a separate national wastewater and sewage-sludge mass balance.
- Reconcile current food-waste, manure, fish-sludge and fish-ensilage quantities.
- Measure dry matter, recoverable solids, moisture, ash, salinity, PFAS, microplastics and heating value.
- Map existing digestate and sludge outlets to avoid double counting committed material.
- Establish regional nutrient balances for nitrogen and phosphorus.
- Map the Oslofjord–Østfold–Västra Götaland–Dalsland commercial corridor.
- Identify the first regional location capable of aggregating 35 MW of conditioned-feed input.
- Keep all 36 development projects separate from operating capacity until commissioned.
- Establish plant-level CUMULUS opportunities across CBG and LBG producers.
- Maintain one reconciled calculation set across the Norway hero, this DD and the BRAD evidence register.
SOURCES
- Biogass Oslofjord — Norwegian Biogas Statistics 2024
- Statistics Norway — national population
- Birgen and Nordtvedt — Mapping Digestate from Norwegian Biogas Plants, 2026
- Norwegian Government — Climate Report 2024–2025
- Norwegian Government — Climate Status and Plan
- Norwegian Environment Agency — transition to biogas in shipping
- Norwegian Agriculture Agency — manure delivery to biogas plants
- Norwegian Government — Action Plan for a Non-Toxic Environment
- Norsk Vann — use of sewage sludge
- Norsk Vann — National Strategy for Sewage-Sludge Treatment
- Veas — wastewater treatment and resource recovery
- Den Magiske Fabrikken
- St1 Biokraft — annual and sustainability reporting